
5pm EDT, October 1, 2015
[This is a cross-post from Stevens Institute’s Davidson Laboratory. It is a multi-contributor post summarizing our flood forecast products and interpretation]
We are closely monitoring a weekend nor’easter and Hurricane Joaquin in the Caribbean, which could approach the NY/NJ region early next week. Our current flood forecasts go out to Sunday evening, and show a strong chance of moderate-to-major flooding for the southern half of the New Jersey Coast. There is a possibility across the region of major flooding and strong winds, and people should continue to monitor the forecasts. However, confidence in the details of the forecast from Sunday onward remains low.
The 5pm central forecast from the National Hurricane Center shows Joaquin heading northward, passing offshore of North Carolina, then north-northeastward toward Cape Cod, passing near our area as a strong tropical or hybrid storm with winds of about 70 mph. However, the actual weather models diverge on two main possibilities – a landfall into North Carolina and a right turn eastward and away from the U.S. Thus, it remains a possibility that Joaquin will not affect our area.
Detailed storm surge forecast interpretation
Our experimental flood forecasts go out 4 days, so do not capture Joaquin’s impact on the area yet. However, the nor’easter may cause substantial flooding this weekend in advance of Joaquin’s arrival, due to surge and rain. South New Jersey in particular is at risk of major flooding beginning Friday and throughout the weekend (Figure 1).
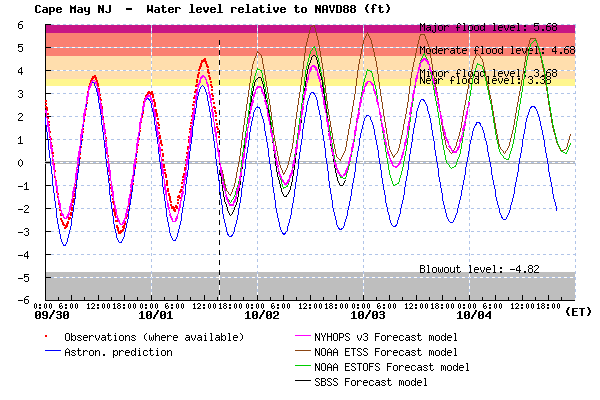
Figure 1: Stevens NYHOPS Storm Surge Warning System experimental forecast for water levels at Cape May (magenta), relative to NAVD88 (similar to mean sea level). Predicted tides are also shown (blue), as well as observed water levels (red), and SBSS and NOAA forecasts for comparison.
Our current forecast for New York Harbor (Figure 2) shows a possibility of minor flood levels this weekend, but the impact of Joaquin on Monday onward is not in our forecast duration and the highly uncertain storm track will determine the impacts.
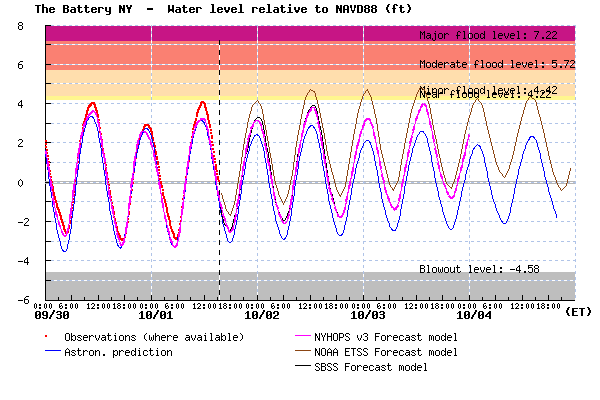
Figure 2: Stevens NYHOPS Storm Surge Warning System experimental forecast for water levels at the Battery, Manhattan (magenta), relative to NAVD88 (similar to mean sea level). Predicted tides are also shown (blue), as well as observed water levels (red), and SBSS and NOAA forecasts for comparison.
Reviewing Davidson Laboratory’s products, we have two main products available – (1) the standard NYHOPS Storm Surge Warning System forecast (http://stevens.edu/SSWS), which includes graphs of our best-estimate flood forecast and also includes NOAA and other forecasts; and (2) We are now producing ensemble flood forecasts – these show multiple flood forecasts, seeking to show all possible outcomes, and can be used to convey flood probabilities. However, these are not yet integrated into our real-time web displays – we are manually distributing these to emergency managers.
The ensemble flood results for Cape May are shown in Figure 3, and demonstrate all the possible water level timeseries that might occur, based on flood model runs (Stevens model) with 70 different weather forecasts from different weather models. These results show that there is a moderate likelihood (27/70 forecasts) that there will be major flooding at South Jersey, and a very high likelihood (69/70) of moderate flooding, by the end of Sunday. This would be before Joaquin arrives, so is flooding caused by the nor’easter that is already on our doorstep.
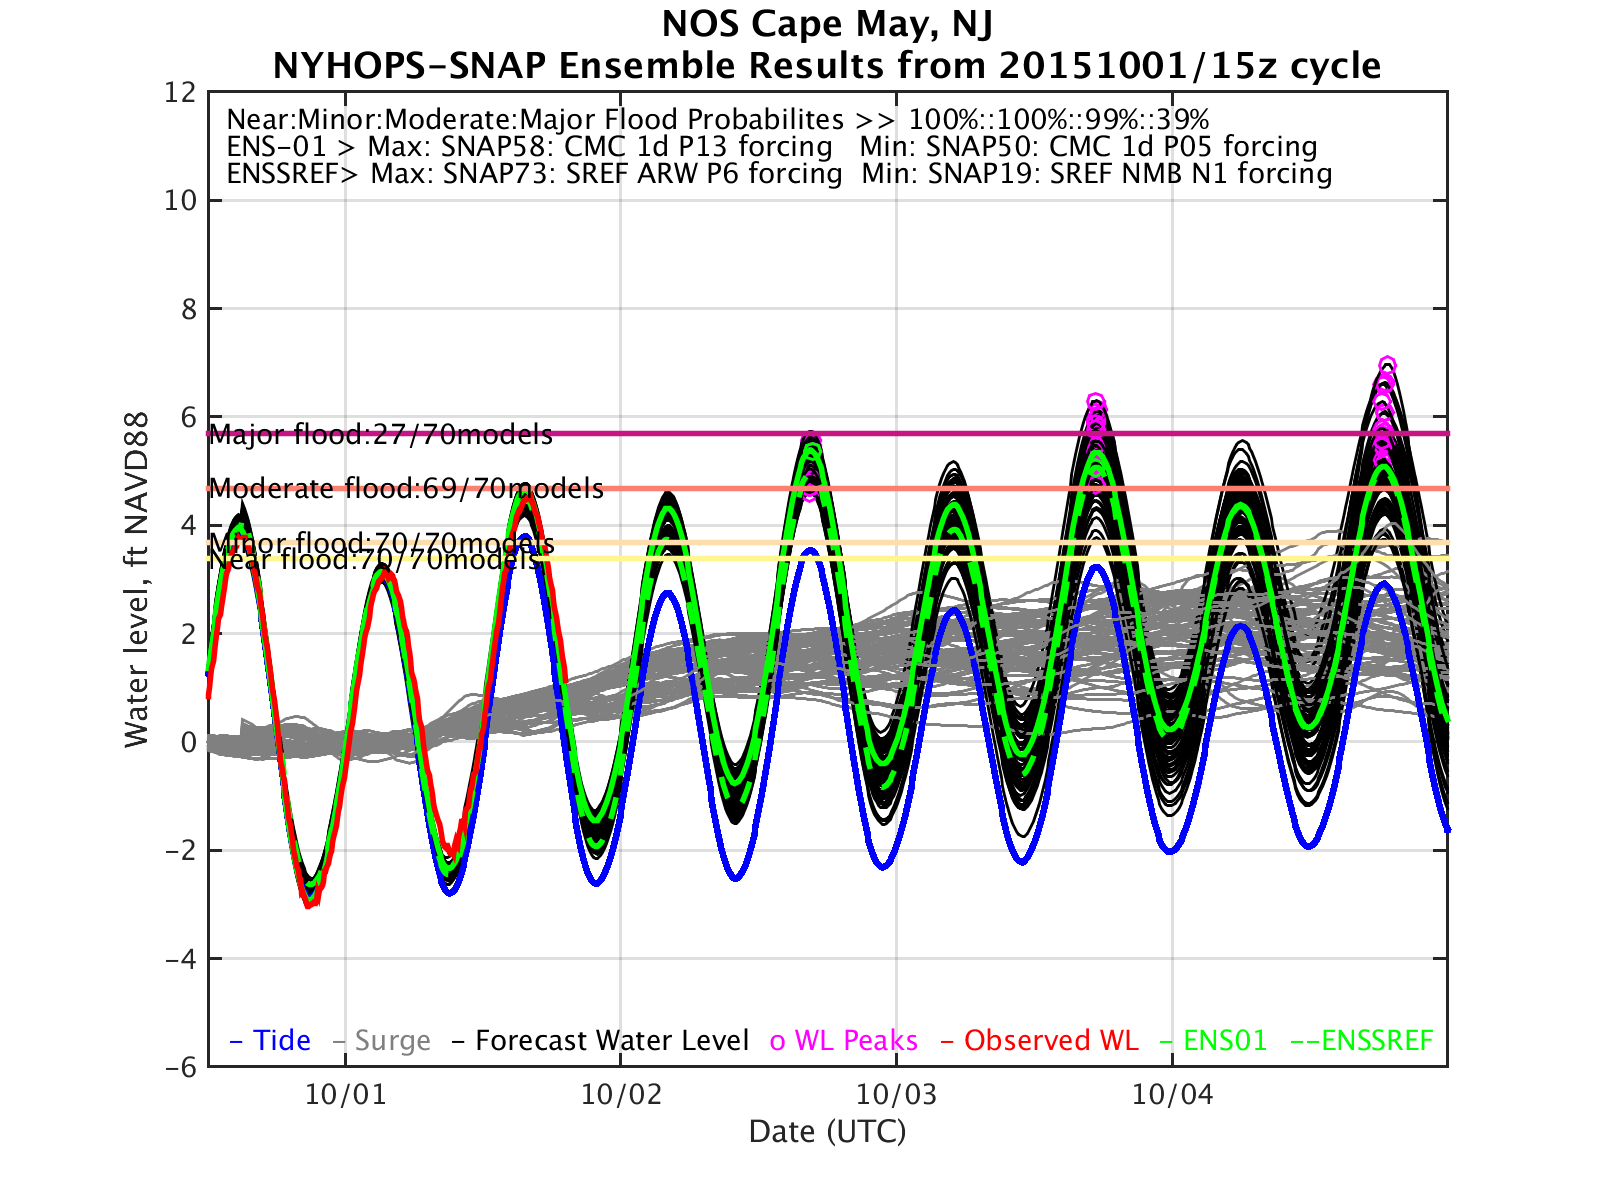
Figure 3: Ensemble flood forecast for Cape May, New Jersey. The red line shows the observed water level, grey lines show 70 cases of modeled storm surge, the black lines show the total water level (modeled surge + tide), green lines show two experimental weighted “best estimates”, and magenta circles show the peaks of each curve. 27 of 70 cases give a “major flood level”, and 69 of 70 a “moderate flood level”, as defined on a site-by-site basis by the National Weather Service.

