Nor’easter “Jonas” Coastal Flood Forecast

A large full-moon tide will coincide with strong winds, snowfall, and a moderate 2-5 foot storm surge this weekend, leading to the possibility of coastal flooding across our region. The areas at most risk for major flooding are Virginia, Maryland, Delaware and southern New Jersey, but minor-to-moderate flooding is likely from Hatteras to Northern New Jersey.  At most, only minor coastal flooding of low-lying areas is expected for the New York / New Jersey metropolitan area with the forecasts seen so far.

Any coastal flooding will likely occur Saturday or the first half of Sunday.

Although there is still moderate uncertainty, forecasted flood levels are roughly similar or slightly worse than those which occurred during the nor’easter that caused flooding in the same areas early last October, at the time that Hurricane Joaquin was threatening to come towards the East Coast.  Winds will be stronger, but the duration of high storm surge will be shorter, lasting through about three high tides.

In terms of waves, NOAA is forecasting maximum 18-foot waves offshore, which are similar to the October storm. However the shorter duration of this storm will likely mean moderate erosion will occur, less than in October.  Beaches that are in good condition should protect the communities behind them; however beaches left vulnerable during the October storm will be weakened even further.

Due to the high tides, any increase in the storm surge or waves could lead to even more flooding or erosion, so we are monitoring our flood forecasts and those of other organizations, which are updated four times per day (www.stevens.edu/SFAS).


Detailed Stevens Institute flood forecasts

The above summary interprets all forecasts, including those of NOAA.  Below is a detailed summary of the Stevens forecasts alone, which are experimental and available for hundreds of specific locations.

Focusing on the regions that have a good chance of seeing major flooding:

The southern half of the New Jersey Coast (Atlantic City to Cape May) is likely to have moderate flooding, and while it is unlikely (0-20% chance), it is possible that there will be major flooding. Expected peak flood levels are about 4-6 feet navd88, which would be similar to the 5-foot flood height that occurred early last October (see figure below).

sfas_plot_CapeMay_160121-0944_SNAP-Ex

Figure:  Stevens Flood Advisory System experimental SNAP forecast for water levels at Cape May (blue), relative to NAVD88 (similar to mean sea level). Observed water levels are shown in red, and the forecast uncertainty is shown in grey (90% confidence interval). (www.stevens.edu/SFAS)

Further south, the outer coastline of Delaware, Maryland and southern Chesapeake Bay regions (e.g. the Norfolk area) will likely have moderate flooding, and major flooding is also a reasonable possibility.  Again, expected peak flood levels are about 4-6 feet navd88, which would be similar to the 5-foot flood height that occurred early last October.

Figure: Stevens Flood Advisory System experimental SNAP forecast for water levels at Lewes (blue), relative to NAVD88 (similar to mean sea level). Observed water levels are shown in red, and the forecast uncertainty is shown in grey (90% confidence interval).

Figure: Stevens Flood Advisory System experimental SNAP forecast for water levels at Lewes (blue), relative to NAVD88 (similar to mean sea level). Observed water levels are shown in red, and the forecast uncertainty is shown in grey (90% confidence interval).


Below are some forecast comparisons between Stevens and NOAA products, to give a sense of the variation between forecast systems. One of NOAA’s forecasts, ESTOFS, is an outlier on the high side, raising the possibility of an extra 1-2 feet of flooding above what is predicted by the other models.

sfas_plot_CapeMay_160121-1427_ALL

sfas_plot_Lewes_160121-1427_ALL


[This is a cross-post from Stevens Institute’s Davidson Laboratory.  It is a multi-contributor post summarizing our flood forecast products and interpretation.]

Posted in Uncategorized, water, weather | Tagged , , , , , , , , , , , , , | 1 Comment

Hurricane Joaquin flood forecast interpretation

5pm EDT, October 1, 2015

[This is a cross-post from Stevens Institute’s Davidson Laboratory.  It is a multi-contributor post summarizing our flood forecast products and interpretation]

We are closely monitoring a weekend nor’easter and Hurricane Joaquin in the Caribbean, which could approach the NY/NJ region early next week.  Our current flood forecasts go out to Sunday evening, and show a strong chance of moderate-to-major flooding for the southern half of the New Jersey Coast.  There is a possibility across the region of major flooding and strong winds, and people should continue to monitor the forecasts.  However, confidence in the details of the forecast from Sunday onward remains low.

The 5pm central forecast from the National Hurricane Center shows Joaquin heading northward, passing offshore of North Carolina, then north-northeastward toward Cape Cod, passing near our area as a strong tropical or hybrid storm with winds of about 70 mph.  However, the actual weather models diverge on two main possibilities – a landfall into North Carolina and a right turn eastward and away from the U.S.  Thus, it remains a possibility that Joaquin will not affect our area.

Detailed storm surge forecast interpretation

Our experimental flood forecasts go out 4 days, so do not capture Joaquin’s impact on the area yet.  However, the nor’easter may cause substantial flooding this weekend in advance of Joaquin’s arrival, due to surge and rain.  South New Jersey in particular is at risk of major flooding beginning Friday and throughout the weekend (Figure 1).

Figure 1:  Stevens NYHOPS Storm Surge Warning System experimental forecast for water levels at Cape May (magenta), relative to NAVD88 (similar to mean sea level).  Predicted tides are also shown (blue), as well as observed water levels (red), and SBSS and NOAA forecasts for comparison.

Figure 1: Stevens NYHOPS Storm Surge Warning System experimental forecast for water levels at Cape May (magenta), relative to NAVD88 (similar to mean sea level). Predicted tides are also shown (blue), as well as observed water levels (red), and SBSS and NOAA forecasts for comparison.

Our current forecast for New York Harbor (Figure 2) shows a possibility of minor flood levels this weekend, but the impact of Joaquin on Monday onward is not in our forecast duration and the highly uncertain storm track will determine the impacts.

Figure 2:  Stevens NYHOPS Storm Surge Warning System experimental forecast for water levels at the Battery, Manhattan (magenta), relative to NAVD88 (similar to mean sea level).  Predicted tides are also shown (blue), as well as observed water levels (red), and SBSS and NOAA forecasts for comparison.

Figure 2:  Stevens NYHOPS Storm Surge Warning System experimental forecast for water levels at the Battery, Manhattan (magenta), relative to NAVD88 (similar to mean sea level).  Predicted tides are also shown (blue), as well as observed water levels (red), and SBSS and NOAA forecasts for comparison.

Reviewing Davidson Laboratory’s products, we have two main products available – (1) the standard NYHOPS Storm Surge Warning System forecast (http://stevens.edu/SSWS), which includes graphs of our best-estimate flood forecast and also includes NOAA and other forecasts; and (2) We are now producing ensemble flood forecasts – these show multiple flood forecasts, seeking to show all possible outcomes, and can be used to convey flood probabilities.  However, these are not yet integrated into our real-time web displays – we are manually distributing these to emergency managers.

The ensemble flood results for Cape May are shown in Figure 3, and demonstrate all the possible water level timeseries that might occur, based on flood model runs (Stevens model) with 70 different weather forecasts from different weather models.  These results show that there is a moderate likelihood (27/70 forecasts) that there will be major flooding at South Jersey, and a very high likelihood (69/70) of moderate flooding, by the end of Sunday.  This would be before Joaquin arrives, so is flooding caused by the nor’easter that is already on our doorstep.

Figure 3:  Ensemble flood forecast for Cape May, New Jersey.  The red line shows the observed water level, grey lines show 70 cases of modeled storm surge, the black lines show the total water level (modeled surge + tide), green lines show two experimental weighted “best estimates”, and magenta circles show the peaks of each curve.  27 of 70 cases give a “major flood level”, and 69 of 70 a “moderate flood level”, as defined on a site-by-site basis by the National Weather Service.

Figure 3:  Ensemble flood forecast for Cape May, New Jersey.  The red line shows the observed water level, grey lines show 70 cases of modeled storm surge, the black lines show the total water level (modeled surge + tide), green lines show two experimental weighted “best estimates”, and magenta circles show the peaks of each curve.  27 of 70 cases give a “major flood level”, and 69 of 70 a “moderate flood level”, as defined on a site-by-site basis by the National Weather Service.

Posted in Uncategorized | Tagged , , , , , , , , , , | Comments Off on Hurricane Joaquin flood forecast interpretation

Chances of Overtopping the Proposed Staten Island Levees

I was interviewed the other day for a 5-minute radio news clip and written article by Matthew Schuerman of WNYC, on the Corps of Engineers plans for protecting Staten Island’s low-lying southeastern neighborhoods from flooding.  A big question was whether the Corps’ planning for sea level rise and use of a 50-year planning period for cost-benefit analysis looked long enough into the future.

Here, I am posting a summary of how I came to the conclusion that the chances of storm surge flooding going over the levees and filling the neighborhoods in the coming 50 years are 4%.  Another statistic I compute, which isn’t in Schuerman’s story, is that the chances of less severe flooding, due to overtopping by waves only, are 24%.  These are approximate percentages, with some simplifications that could be improved upon fairly easily, but the computations were done quickly last Thursday for his story airing tomorrow.

There are two types of flooding that might occur — wave overtopping and still-water level overtopping.  Wave overtopping would periodically send water over the levee, when waves strike.  Still-water overtopping is what occurred during Sandy, when the average water level at the worst of the storm was about 3 feet above Father Capodanno Boulevard, so the water was rushing in continuously, and rapidly filled the neighborhoods with water.

A 4% chance over 50 years is fairly low odds, but important because it is important that people not consider these levees as ‘protection’ so much as ‘risk reduction’, following the wording changes preferred by the Corps and NYC.

Quoting the Corps Interim Feasibility Report:

In the very rare occurrence that coastal stillwater levels exceed the 15.6 feet NGVD 1929 design level of the project (approximately a 0.3% annual-chance-event or about the 300 year storm), the ocean surge could breach the line of protection inundating the study area to the level of surge.  Therefore it is extremely important that residents follow New York City evacuation orders and protocol to help decrease risks to life safety in the event of a severe coastal storm event.

Now, onto the technical details — The Corps of Engineers designed the elevation of the levees based on the benefits vs costs for the next 50 years, and came up with an optimal height of 19.8 feet above mean sea level (20.5 ft NGVD29).  Based on my quick reading of their report and some quick Q&A with someone from the Corps, this appears to include a flood level of 14.9 ft above mean sea level, plus 0.7 ft for continuation of the past sea level rise rate, over the next 50 years, plus (I assume, from subtraction) 4.2 ft to account for wave crest heights and possible overtopping of the levee due to waves.

According the the Corps, with today’s sea level, the return period of a flood that would cause waves to overtop this is 300-years; that means in 2015 there is only a 0.3% chance of waves overtopping it this year (if the system were built today).  The return period of a flood that would cause still-water overtopping of the levees is about 2000 years, or a 0.05% chance per year.  I am estimating these from FEMA’s data, which I used in our New York City Panel on Climate Change (NPCC) report chapter on how sea level rise would impact flooding around NYC.  The Corps used their own data, which I do not have access to, so they might get slightly different results.

The president’s recent directive on planning infrastructure have suggested one should use a conservative high-end approach to accounting for sea level rise when planning infrastructure, aiming for 500-year flood, 100-year plus 3 feet, or best available information, which we actually have in this case from the latest 2015 report from the NPCC.

The Corps apparently isn’t yet instructed to think in this way, and this is often the case with federal government, given the hot button issue of (whisper) climate change. And thus, they are using the 0.7 ft based on the historical, linear sea level rise rate instead of these other choices.

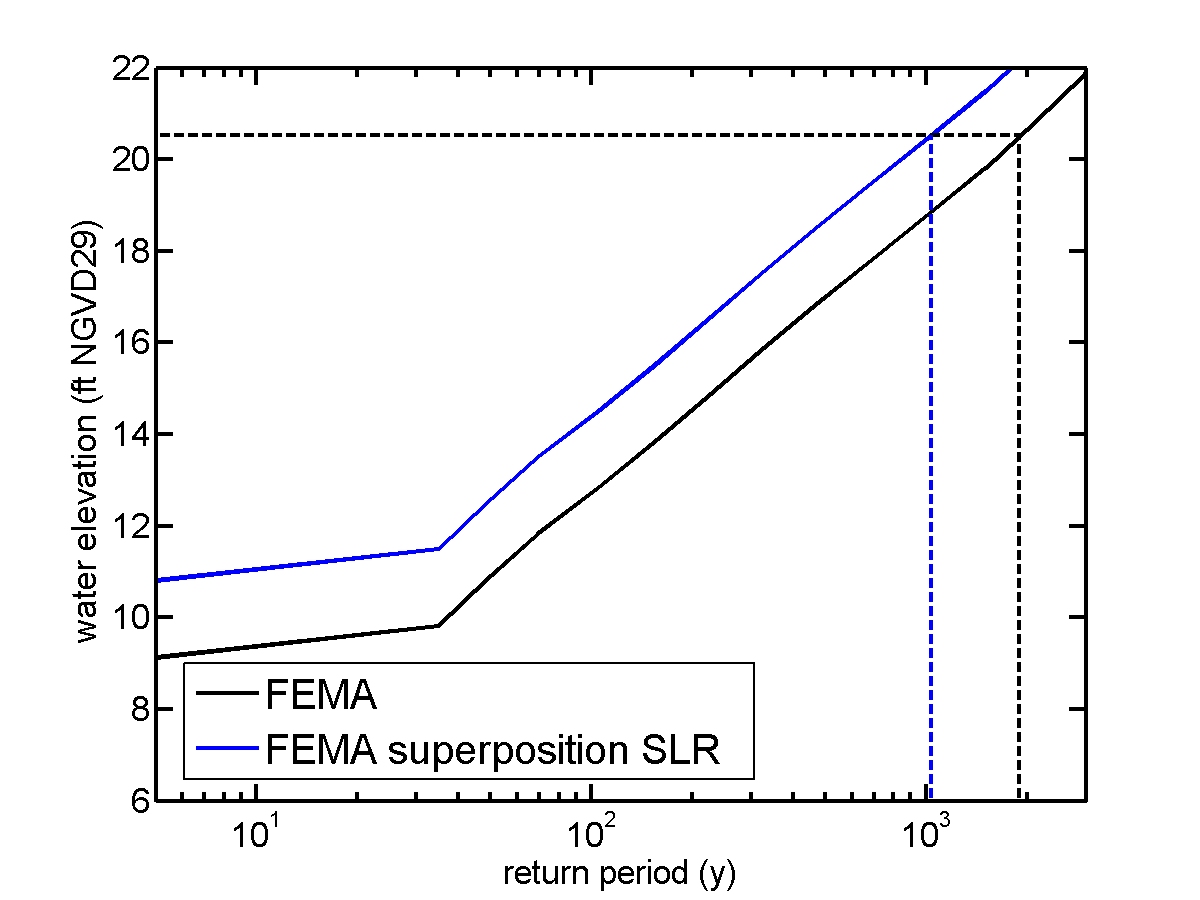
First, looking at the probability of the less likely (but more severe) case of still-water overtopping, illustrated with the figure below — If I take a mid-range (50th-percentile) estimate of 20 inches of sea level rise by 2065 from the NPCC (doing some simple linear interpolations from numbers in their report), the return period of the flood that would overtop the structure reduces from ~2000 years to ~1000 years by 2065, meaning about the chance each year goes from 0.05% per year to a 0.1% chance per year.

Flood exceedance curves, showing return period versus storm tide height. (black) FEMA's flood return period curve for Midland Beach, Staten Island, offset by +0.6 feet to match the Corps' numbers. (blue) the same curve, offset by 20 inches of sea level rise, showing a reduction in return period (dashed lines) to ~1000 years.

Flood exceedance curves, showing return period (10, 100, 1000 years) versus still-water elevation. (black solid line) FEMA’s flood return period curve for Midland Beach, Staten Island, offset by +0.6 feet to match the Corps’ numbers. (blue solid line) the same curve, offset by 20 inches of sea level rise, showing a reduction in return period for the 20.5 foot flood from ~2000 years (dashed lines) to ~1000 years.

These are low odds, but a roughly 0.1% chance per year over 50 years adds up, though probabilities don’t exactly add/sum (see footnote below on how I make this computation).  The probability of still-water overtopping the levee at any time over this 50-year period is 4%.  Again, this accounts for a mid-range estimate of sea level rise.  Performing the same computation with a high-end 90th-percentile sea level rise of 39 inches by 2065, this rises to 6%.

Lastly, looking at the probability of the more likely case of wave overtopping of the levee — using the mid-range NPCC sea level rise estimate and also accounting for higher wave crests hitting the shoreline (deeper water means less breaking, higher wave crests by a factor of 1.55 times sea level rise), the return period of the flood that would overtop the structure reduces to 130 years in 2065, meaning about the chance each year goes from 0.3% per year to a ~0.8% chance per year. (If one assumes high-end sea level rise occurs, the result is a 45-year return period in 2065).  The cumulative probability of wave overtopping over 50 years is about 24%. (Or 44% using the high-end estimate of sea level rise).


Footnote on accumulated probability of flooding, over time — I actually compute this as the chances of NOT flooding, by multiplying each year’s chances of not flooding, then subtract the result from 100%.  This is like flipping a coin twice — each time, the probability of getting heads is 50%, but you don’t simply sum them to know the probability of heads after two flips (100% is not correct).  The probability of getting heads after two tries is actually aggregated using the multiples of each flip’s probability of not succeeding (1/2 times 1/2 equals 1/4), then taking 1.0 minus this value, giving 0.75 or a 75% chance.  In Matlab, I am linearly interpolating the (growing) annual flood probability for each year between 2015 and 2065, and then I compute the cumulative product over a string of 50 years.

Posted in Uncategorized | Tagged , , , , , , , , , , , | Comments Off on Chances of Overtopping the Proposed Staten Island Levees

Increasing coincident surge and rain flooding

An important study was just published in the journal Nature Climate Change, on the topic of coincident rainfall and storm surge, termed “compound flooding”.  We knew that storm surges and heavy rainfall events were both getting worse in some places, such as New York City.  However, most storms with rain don’t have storm surge, and vice-versa, and an example of storm surge without much rainfall is Hurricane Sandy.  On the other extreme is Hurricane Irene, which came with both heavy rains and a moderately bad storm surge that spilled over into some neighborhoods.

The main finding of this paper is that they have discovered several cities in the U.S. where cases of storm surge and severe rainfall are increasingly coming at the same time.  They looked nationwide and found several example cities where these problems are increasingly linked, and New York City was highlighted as one of them.

This is important work, because when you live near the ocean and hear about flooding you often are hearing about compound flooding, and more specifically rainfall flooding that will not drain through sewers because the sewer outlets are submerged by high tides.  Many neighborhoods around New York City, such as Hoboken or Red Hook for example, are at an elevation that is not more than a few feet above high tide, and their sewers are several feet beneath the street, so need to be pumped out at their ocean end.  If there is a high tide or a heavy rain event, then the water can’t be removed quickly enough, and floods the streets.

One thing that’s not certain from the paper is whether the increase in joint occurrence of rain and surge is being caused by manmade climate change or whether it is a passing trend.  We have evidence that global warming has led to heavier rainfall in some places, and there is high confidence that warming will lead to more heavy rain events globally (IPCC AR5, 2013).  We also know that sea level rise is creating more coastal floods, and this will intensify as sea level rise accelerates (IPCC AR5, 2013).  Whether this pair of troublemakers will become closer allies in the future is harder to predict.  But this paper is one of the first ever to lay out useful statistical methods and look at the problem over such a broad area, so it’s a step in the right direction for better understanding the science, and monitoring how things change.

As far as solutions go, levees or storm surge barriers can protect against storm surges, but they will generally not stop rainfall flooding when a neighborhood is below high tide, as will be the case for an increasing number of neighborhoods as sea levels rise.  For this problem, cities like Hoboken and Jersey City have been investing heavily in large pumps, but these often cause complaints due to excessive noise.  And they are increasingly seeking to build green infrastructure that can absorb rain water, such as green roofs or bioswales; anything porous that can at least temporarily hold onto rain water.

Posted in climate, water, weather | Tagged , , , , , , , , , , , , | Comments Off on Increasing coincident surge and rain flooding

Coastal Flood and Wave Forecast for the Blizzard

In a prior post, I laid out the dangers of combined ice, snow and storm surge flooding.  It is a potentially catastrophic risk, as exemplified by the Blizzard of ’78 in New England.  But fortunately, it’s very rare and perhaps unprecedented at the New York City area to have a combined severe snow and coastal flood event.  This is likely just due to the low probabilities of multiple “bad luck” coincidences coming at one time (winds of the right direction, the right speed, a slow-moving storm system, large tides, a moisture source, and temperatures needed for heavy snow).

While the wind will be dangerous and snow is likely to be severe (18-24″ is presently forecast) and potentially even historic, fortunately there are several signs that this will not be more than a minor flooding event in the New York City metropolitan area.  For one thing, the surge is very unlikely to be more than 3 feet, and for most locations, more like 1.5-2 feet.  The tides are not large, running about 4.5 feet at New York Harbor (Battery tide gauge).  And the winds are predicted to be from the northeast today, but at the worst of the storm they will rotate and come out of the north, whereas our worst flood events are more of a northeast to southeast wind direction.  And lastly, while the storm is going to move slowly, it won’t move slowly enough to build up a large surge — the surge should only build for about a day maximum, in contrast to Hurricane Sandy’s surge which built up for three days.

Coastal flood forecast for New York Harbor in feet above mean lower low water (average daily low tide).

Coastal flood forecast for New York Harbor in feet above mean lower low water (average daily low tide).  In addition to the astronomical tide prediction, three forecasts are shown.  The Stevens forecast is the magenta line.

Currently, our forecast with our Storm Surge Warning System is predicting only 1.5 feet of storm surge, on top of a moderate high tide, so no major flooding problems for the New York Harbor area (some flooding may occur at places that flood multiple times every year).

The difference between forecast models is somewhat interesting for western Long Island Sound, at Kings Point.  NOAA models are forecasting a 3-4 foot surge, whereas Stevens is predicting a 1.5 foot surge.  If the NOAA models were correct, again flooding would only occur are areas that see flooding multiple times per year.

caption here

Coastal flood forecast for western Long Island Sound (Kings Point) in feet above mean lower low water (average daily low tide). In addition to the astronomical tide prediction (blue), four forecasts are shown. NOAA forecasts are in green. The Stevens forecast is the magenta line.

Forecast models disagree because the ocean models are different, because the weather models they rely upon are different, and for a host of other reasons.  So, we’ve learned that one model is never perfect and having a set of forecasts is useful.  So, a cool thing we’re working on with our flood forecasting is to eventually merge many forecasts into one, called ensemble forecasting.  While our graphics now show 3-4 forecasts from different groups, we are studying how we can make dozens of forecasts and merge them into one that has an uncertainty represented.  A useful way this can be presented is as percentiles — if someone wants to see “worst case” estimates, they will be able to look at the 90th-percentile flood height forecast.  If they want the “central estimate” they can look at the median 50th-percentile forecast.  Coming soon!

The southern New Jersey coast is likely up for a more dangerous event, as they will bear more of the brunt of the storm, with ~2 to 3 foot storm surges and moderately large waves.  The NYHOPS forecast for waves at Atlantic City is 6 feet.

caption!

Coastal flood forecast for New York Harbor in feet above mean lower low water (average daily low tide). In addition to the astronomical tide prediction, four forecasts are shown. The Stevens forecast is the magenta line. Large waves and erosion could also be a factor on the Jersey Shore.

Also, parts of New England are also threatened by the very large waves, forecast to be roughly 20 feet!  Waves are often an important part of their coastal winter storm risk.

NOAA Wavewatch forecast for the US East Coast.

NOAA Wavewatch forecast for the US East Coast at 8:00AM Tuesday (EST), with colored wave heights in meters.

Shorelines of Massachusetts and New Hampshire may be where the largest coastal flood and wave risk is, but again they are lucky it is not a large, spring tide, as occurred during the Blizzard of 1978.

Posted in Uncategorized | Tagged , , , , , , , , , , , , , , | Comments Off on Coastal Flood and Wave Forecast for the Blizzard

Why I Am Marching for Climate

On Sunday at noon, many thousands of concerned citizens will be marching to the United Nations in Manhattan to protest the lack of progress to reduce global carbon dioxide emissions, with the 2013 rate at its fastest rate ever.  Each year, believe it or not, 80,000,000,000,000 pounds of carbon dioxide are dumped into the atmosphere by us humans.  I was a panelist on Wednesday at an event at the Church of the Holy Trinity, and laid out reasons to march, beginning with the future impacts on New York City, but concluding by looking more broadly at the moral reasons we need to act to reduce our climate impact.

global_co2_emissions

In 2013, our emissions were about 80,000,000,000,000 pounds of carbon dioxide, or about 22,000,000,000,000 pounds of carbon (10 Gigatons)

There are three main future direct impacts of climate change on NYC:  (1) heat waves will be increasing, making life more difficult in the city — we all know it can get disgusting when it gets over 90 degrees in the summertime, and it is projected that the number of these heat wave days will double or triple by the 2050s. (2) Cases of extreme rainfall have been on the rise already in our region, and will continue to increase.  And (3) sea level rise, which is one of the most guaranteed impacts, though the exact amount to expect is still highly uncertain.  Sea level rise is a very serious problem, especially for low-lying neighborhoods and cities (e.g. Miami).

I’m an oceanographer and will focus more on sea level rise, but am a member of the New York City Panel on Climate Change (NPCC), so I can speak to the science of any of these topics.  After Hurricane Sandy, the NPCC was reconvened by Bloomberg, and here are the main conclusions of relevance to coastal flooding:

  • By the “2050s” sea level rise median forecast is about 1.5 feet (the “low end” 10th-percentile projection is 8 inches, and the “high end” 90th-percentile projection is 32 inches)
  • Future changes to storms by 2050s for the NYC region are not well known
  • For the total number of North Atlantic hurricanes, the direction of change is unknown
  • The number of intense hurricanes is “more likely than not” to increase

The media and advocates for climate policy tend to try to focus on the danger of climate NOW so focus on storms, but the science of storms and climate is not settled.  So, I prefer to speak about the sea level rise, as it is more of a guaranteed impact of climate change and will eventually transform our coastlines and coastal cities.

The NPCC projections cover a range of different future decades out to 2100, but I choose the 2050s because it is within most of our lifetimes and the typical planning time for people’s lives, such as a 30-year mortgage on a home.

Sea level rise has not accelerated dramatically (yet).  Global sea level rise rate has roughly doubled comparing the 20th century to the last 20 years.  In New York City, we’re getting 1-2 inches of sea level rise per decade right now — this is NOT dramatic, but it in total, we’ve had a foot of sea level rise in the past century, and it already adds up to regular flooding problems for low-lying areas.

Speaking in more detail about what the median estimate of 2050s sea level rise would mean for our city and for the world, let me illustrate some of the problems.

  • Many more low-lying city areas will have “nuisance flooding” from rainfall and regular high tides
  • A higher risk of a devastating Sandy-like flood, as the extra sea level raises the flood heights
  • Many other areas of the world will experience a dramatic rise in flooding problems and building levees and incurring high expenses to protect property
  • Beaches will become less natural, more man-made, or even potentially disappearing and only being walls in areas where there are neighborhoods that need flood protection.  A higher rate of sea level rise means a larger need for dredging sand up from offshore (“replenishment”), and eventually this will be deemed too expensive, starting with poorer countries and lower population beach communities of the United States (e.g. Fire Island, Long Beach Island, Hatteras).

New York City is turning 350 years old this year … looking ahead 350 years or more, what are the long-term implications for NYC and the rest of civilization? (and speaking to the church audience: For that matter, “God’s creation”?)

Scientists have coined a new term: “committed sea level rise“, which is the amount of sea level rise that will still occur from a given year onward even if emissions were immediately halted.  Emissions of carbon dioxide have a long residence time in the atmosphere (centuries), so cause an enhanced greenhouse effect for centuries.  The response of ocean warming and expansion takes a long time to occur.  The melting of ice takes an even longer time to occur — this is because the thicker ice is, the longer it takes to melt, and we are talking about miles-thick ice on Antarctica and Greenland.

All this slowness all together is a form of inertia.  While we’ve been fortunate in our lifetimes that sea level rise reacts slowly, when we stop the emissions, the sea level rise and our impacts we have created will worsen for hundreds and perhaps even thousands of years!

The current estimate of committed sea level rise is about four feet, which would (WILL, actually) play out over many hundreds of years.  Every decade of inaction we add about one more foot to our commitment.  Every decade we have increasing emissions, the sea level rise we impose on future generations accelerates and becomes more unmanageable.  Another new term was created that summarizes this well:  Inter-generational injustice.

Is it really our place to impose these kinds of impacts on future generations and on the planet?

Is it our place to drive accelerating sea level rise so that beaches will be turned into seawalls?

Is it our place to turn coral reefs into dust, due to ocean acidification by our carbon dioxide emissions?

Is it our place to have snowy peaks melting to mud?  New York’s mountains will eventually no longer have regular snowpack in the winter.

Is it our place to leave behind a world where populations in many areas are struggling even to survive because the local climate there is no longer habitable, for example because mountain ice has melted and no longer provides drinking water?

Some damage is already unavoidable.  But by acting sooner and stronger to limit emissions and resulting climate change, we can reduce these impacts.  On Sunday, this is why I will bike across town to the west side of Manhattan, and then march to the U.N. in what is likely to be the largest climate change demonstration ever.

Posted in climate, opinion | Tagged , , , , , , , | Comments Off on Why I Am Marching for Climate

Resilience Concepts Behind Living Breakwaters

I was asked by an intern at City Atlas, Travis Gonzales, to answer his well-posed questions on our winning Rebuild By Design entry, Living Breakwaters, and here is that Q&A, which I think gets addresses some important aspects of the concept.

1. The proposal for Living Breakwaters states that the breakwater system developed to protect Staten Island’s coastline could be used in other vulnerable communities. Yet, the Island’s location at the mouth of the harbor makes for a special case of erosion. Do you think that a proposal like this, and Rebuild’s competition by extension, supports experimenting with coastal protection locally in a way that can be used throughout the coastal US?

Staten Island is a somewhat unusual semi-protected coastal location, where waves are typically small, but can be large during coastal storms.  However, the irregular US Northeast coast has many locations with similarities, such as beach areas near Boston, as well as all of coastal Masschusetts and New Hampshire.

A distinguishing feature of a coastal area like that of Staten Island is that waves are not a normal feature utilized for recreation, such as surfing.  So, it’s an ideal location where modification of the wave climate will not cause opposition of surfers and others who enjoy the waves.  However, the approach could also be used selectively at open coastal locations where there is surfing, as long as surfers are brought into the process of planning reefs that they might enjoy using for surfing.

2. Because the breakwaters aren’t a type of levee or berm but instead a buffer, how long do you think they will remain effective, given issues like continual sea level rise or the potential for stronger storms?

One of the main innovations with the breakwaters is that they are designed to GROW with sea level rise, as oyster beds can easily grow at a similar or faster rate.

In terms of extreme storms, which can happen today and aren’t only a thing of the future, the breakwaters gradually become less effective at reducing wave heights as a flood deepens above them.  But this is part of the plan; the purpose of our approach is actually to NOT have a flood elevation where the adaptation abruptly becomes useless (or worsens the dangers).

This is in contrast to levees, which always have a “design height” and this is typically the height of a 100-year storm, plus one or more extra feet allowing for sea level rise.  Once the flood goes above a levee design height you have abrupt rushing water filling in the “protected” area, which can make the hazard MORE deadly than a gradually rising water level.   In New Orleans, this occurred many times over and over through history, not just in 2006 (see this reference).  The paired problems of sea level rise and urban coastal flooding is a very complex and dynamic problem involving not just physical flooding, but also sociology, psychology (do I evacuate?), economics and politics.  Levees are a static solution to this very dynamic problem.

3. Staten Island coastal areas, while good for recreation, do not have the same vital infrastructure points as Lower Manhattan. Why is protecting Staten Island a concern for New York City?

Actually, the project isn’t really about “protecting” Staten Island.  It aims to improve the area’s resilience in a much broader way, including economics and coastal storms.  We do this by restoring Staten Island’s historical water culture, reducing flood and wave risks, reducing erosion, improving educational and recreational opportunities at the shore, and thus making the ocean tides and waves (and their risks) more visible and tangible.  It’s much broader.

New York City has a very large coastal population in flood zones, and they expect something to be done in response to Sandy, and the options often boil down to vertical protections (e.g. levees) and other options, and we feel we have created a very appealing alternative.  That being said, our living breakwaters are an offshore option, and communities can still work with the city and Corps of Engineers to build vertical protections such as dunes or levees.

4. If you have any other thoughts or insights on Rebuild by Design that you’d like to share, please do.

When there is a disaster, the political response by government is to try to help people and to stop the same disaster from happening again.  But when it comes to coastal flooding, it’s also important to have some sort of long-term thinking.  We know we have many feet of future sea level rise coming, possibly within just this century, and simply stopping today’s flooding problem isn’t necessarily the best solution.

This was the brilliant justification behind Rebuild By Design — bringing the world’s designers, scientists and engineers together to come up with new ideas for more forward-thinking solutions to the increasing problem of sea level rise and coastal flooding.

Posted in climate, security, water | Tagged , , , , , , , , , , | 1 Comment

Living Growing Breakwaters and Building Community Resilience

We had great news a few weeks ago — our team was selected as a winner of the HUD Rebuild By Design competition, and New York State is being awarded $60 million to build out our project — Living, Growing Breakwaters off Staten Island.

Kate Orff and her team at the SCAPE design firm built the team and led the effort, and it was an honor to get to be a part of it.  For the final review, teams were asked to make videos, and here is the one by our team – it keeps getting positive reviews, so is worth sharing far and wide.  In it, we explain many of the innovative aspects of our living growing breakwaters, as well as our approaches to stepping down risk instead of falsely hoping to eliminate it, making the hazard more visible and making urban coastal communities more resilient through education and interaction with the ocean.

I recommend watching the video, but in case you would like to read, the transcript of my statements on coastal flood adaptation and how we used ocean modeling to test our breakwaters follows.

The layering of coastal protections is important because sometimes one protection type such as a levee can fail or be over-topped.  It’s better to have multiple, layered protections and that can come in many forms.  Having an ecological approach, one case would be to have large expanses of oyster reefs or wetlands that can reduce the flooding before it reaches your seawall.

We were reminded by Sandy that this region, northern New Jersey and New York City, is susceptible to being hit by a hurricane, which hadn’t happened in over 100 years.  And so we were reminded that we have to deal with this issue sooner than we realized with sea level rise and natural storm surges that don’t even necessarily have to do with climate change.

In the case of the storm surge, Raritan Bay is in a bad location, and Staten Island is very vulnerable to storm surge because it is in more of a funnel shaped area where the storm surge comes in and it actually gets larger as it comes into the point of that funnel.

Peak water elevations during Hurricane Sandy in meters above mean sea level

Modeled peak water elevations during Hurricane Sandy in meters above mean sea level. With Sandy “captured” by the computer model, we can run experiments on the storm, testing how different adaptation strategies can impact flooding and waves.  

A benefit of computer models is that they synthesize all scientific understanding of coastal storm surge and waves and they give us an objective answer.  Many people have an opinion or even political viewpoints driving what they think we should do about coastal flooding and sea level rise, but the benefit of computer models is that they give us an objective answer based on the best available science.

In terms of risk reduction, the goal of the breakwaters is only to reduce wave impacts at the coast, not to stop storm surge, and it leaves the choice of what is done at the coast (e.g. dunes, raised berms) to the Corps and local communities.  The model results show an up to 4 foot reduction in wave height at Staten Island’s shore (during a Sandy-like storm), which could ultimately reduce erosion during winter storms, make the coastal areas safer during more extreme storms, and reduce the FEMA V-Zones and Coastal A-Zones.

Risk reduction doesn’t always have to come in the form of vertical walls.

Posted in security, water | Tagged , , , , , , , , , , , , , , , , , , | 1 Comment

Increasing storm tides in New York Harbor, 1844–2013

We published a paper in the journal Geophysical Research Letters in May (paper, supporting information), and a very important yet simple result from the paper is that Stefan Talke (Portland State University) recovered historical sea level data from NY Harbor and created this great 1844-2013 dataset for annual maximum storm tide that is twice as long as datasets previously available.

Annual Maximum Storm Tide from gauges around the New York Harbor area.  The error bars denote the estimated precision, and the dashed horizontal line depicts the 1.75m AMST threshold (a nominal seawall height for Manhattan).

Annual Maximum Storm Tide (AMST) from sites around the New York Harbor area. The error bars denote the estimated precision, and the dashed horizontal line depicts the 1.75 m AMST threshold (a nominal seawall height for Manhattan).

This figure shows the annual maximum storm tides (AMST) in meters above mean sea level — water levels purely driven by storm winds, atmospheric pressure, and tides. Looking at these data one can clearly see that the storm tides have been increasing, and much of the paper is about quantifying this trend and also the variability. Each bar on the plot represents a year’s maximum flood height minus that year’s mean sea level, so sea level rise is not the reason you see increasing AMST.

A sound-byte in the media articles has been the part of the final sentence of the paper’s abstract, which reads “… the annual probability of overtopping the typical Manhattan seawall [has risen] from less than 1% to about 20-25%.”  This is unquestionably a powerful result!

This has led to headlines such as this one from Salon:

Manhattan’s surging flood risk: City could end up underwater every 1 in 4 years” – Salon.com (with a photograph of deep-water flooding in Manhattan during Sandy)

I want to make clear that just because a seawall is overtopped doesn’t mean the city is “underwater”.  There are many different flood height thresholds for flooding different neighborhoods, and the 1.75m threshold is just a nominal Manhattan seawall height (from Colle et al. 2008) and even those vary substantially in height.  The National Weather Service considers a 1.8m flood height to be the threshold for “moderate flooding” at NY Harbor.  But in most places, only a waterfront walkway or park floods with a 1.75m or 1.8m flood height, and neighborhoods are dry until the flood height reaches a higher elevation.

We are trying to work with NYC to quantify what neighborhoods flood at what flood heights, but we already know that at least a few neighborhoods of NYC are susceptible to flooding at low levels of ~2m (about a 10-year flood event).  On the other extreme, we also know that about 5% of the city population had floodwaters during Hurricane Sandy.

Stefan and I estimate Sandy to be a roughly 300-year return period flood event (unpublished work), so this is not something I personally expect to occur again frequently.  This estimate is based on historical data only, and if storms are changing, then it may underestimate the frequency of such floods.  There is some evidence for an increase in North Atlantic storms and their intensity (National Climate Assessment, 2013, Chapter 2), but scientists are still debating whether climate change is responsible and whether the trend will continue into the future.

A less frequent focal point of the media is the great story of discovery of the historical data, explained in this nice video:

The American Geophysical Union did a great job with the video, capturing the wonder and excitement of the data archaeology and research.

Posted in climate, urbanoceanographer, water, weather | Tagged , , , , , , , , , , , , , | Comments Off on Increasing storm tides in New York Harbor, 1844–2013

Winter Coastal Storms – a Dangerous Mix of Hazards

The winter storm hitting us right now is a reminder of how coastal flooding and winter storms can mix and bring a dangerous combination of hazards.  While the winds in this storm are substantially weaker (good news) than the Blizzard of ’78, both storms hit during extreme spring tides. The 1978 storm was the worst flood event on record for places like Boston.

Winthrop Drive, in the Beachmont section of Revere, Mass., was flooded by waves and tidal surge during the Blizzard of '78 that overflowed the seawall (credit: The Boston Globe)

Winthrop Drive, in the Beachmont section of Revere, Mass., was flooded by waves
and tidal surge during the Blizzard of ’78 that overflowed the seawall and froze in the streets (credit: The Boston Globe)

The Blizzard of ’78 caused record flood levels and also multiple feet of snow.  Combined with freezing temperatures this led to a very dangerous disabling of coastal communities in the Gulf of Maine and Massachusetts Bay.

Rescue worker struggles to haul evacuation boat to the front door of this home in Revere, Mass (photograph by Paul Benoit, Boston Herald American).

Rescue worker struggles to haul evacuation boat to the front door of
this home in Revere, Mass (photograph by Paul Benoit, Boston Herald American).

The storm surge forecasts at New York City, Long Island Sound, and the New Jersey Shore for this evening’s storm are only calling for about 2 feet of storm surge, but it is coming on top of some of the year’s highest tides.  We do not provide forecasts for Boston, but our forecasts for The Battery and Kings Point, in the NYC region, suggest only a 1.5 foot and 2.0 foot surges, respectively.  NOAA’s two models predict a ~2.5 foot surge and ~3 foot surge at these same locations.

caption

Stevens NYHOPS Storm Surge Warning System forecast for water levels at Kings Point (magenta), relative to mean lower low water (MLLW – normal daily low tide). Predicted tides are also shown (blue), as well as observed water levels (red) and two NOAA ET-Surge forecasts for comparison (green).

Above is the figure showing the astronomical tides, as well as several forecasts for water level, suggesting that moderate flooding (barely over seawalls in a few places) may occur in Long Island Sound.  Flood levels in the direst forecasts at the moment are more than 6 feet lower than those seen during Sandy for The Battery and ~3 feet lower at Kings Point, Long Island Sound.  Check for yourself as the storm proceeds, using the Storm Surge Warning System.

Posted in security, Uncategorized, water | Tagged , , , , , , , , , , , , | Comments Off on Winter Coastal Storms – a Dangerous Mix of Hazards